User Evaluation
AI pipeline optimisation
AI research, with less cost per job.
User Evaluation turns interviews into findings backed by source material. We optimised the AI pipeline behind its transcription, chat and reports, reducing the cost of each job while preserving its internal quality benchmarks.
What we changed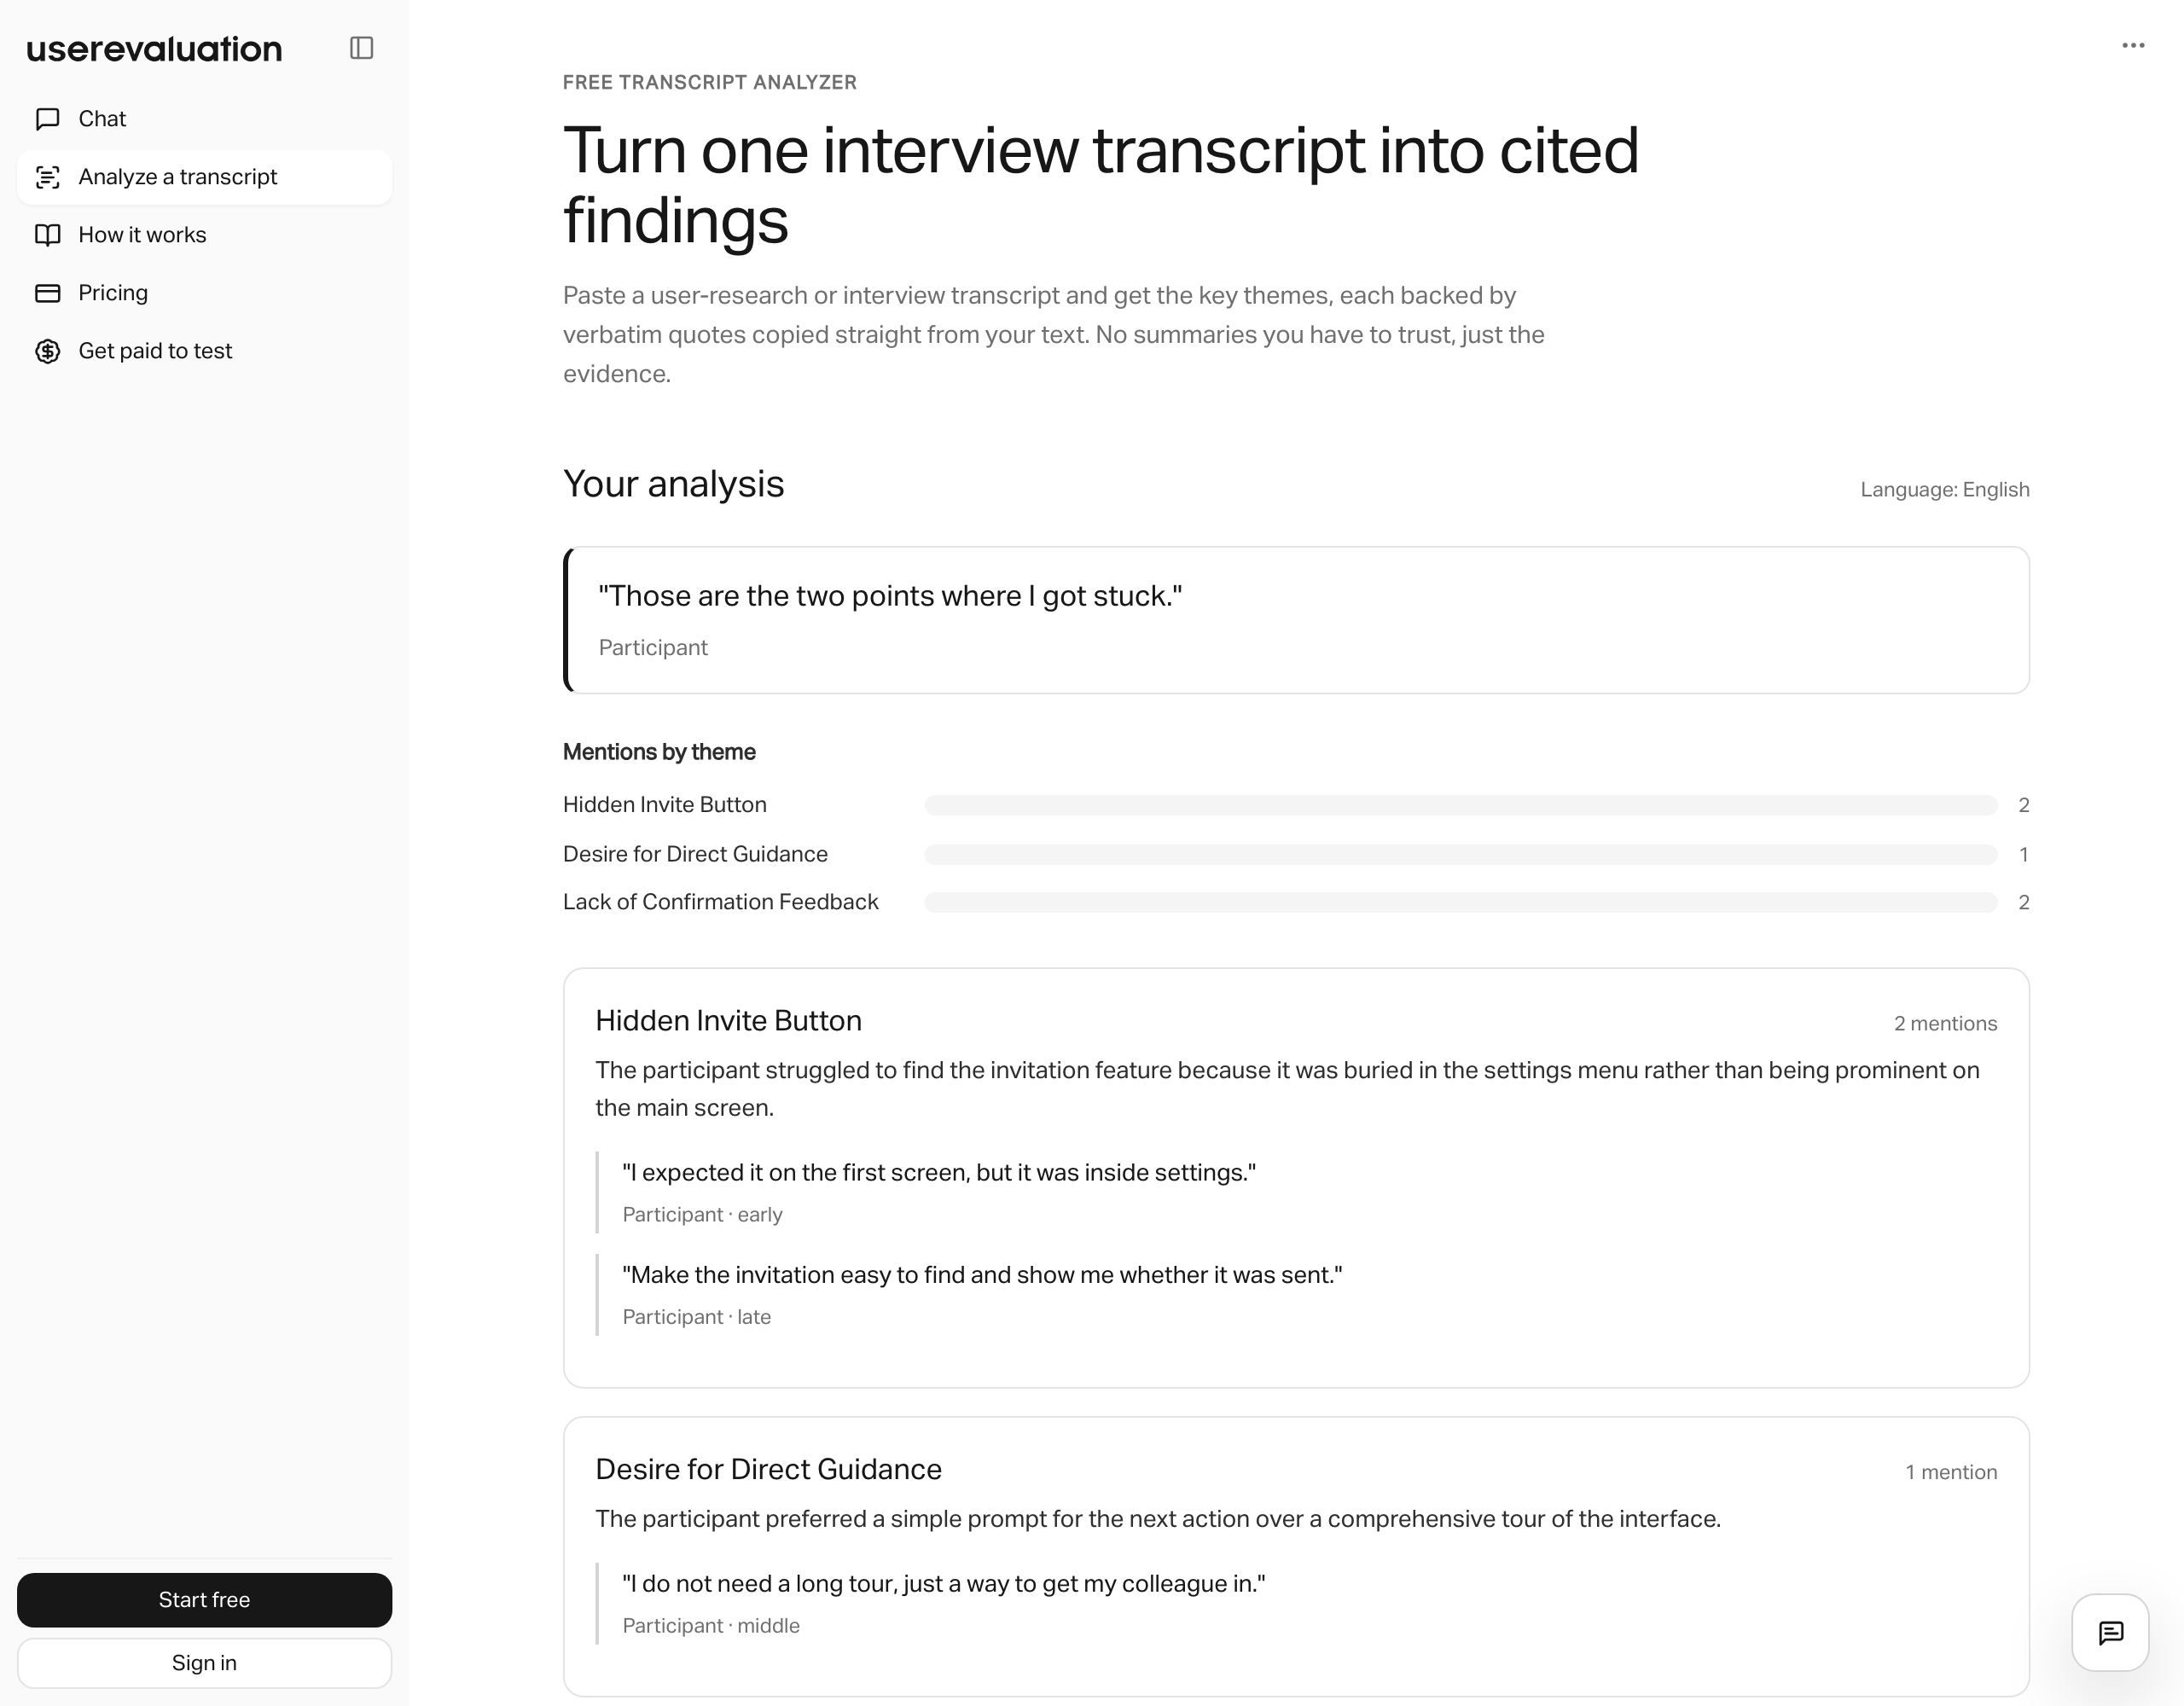
Finding from the transcript
The invitation is hard to find.
“I expected it on the first screen, but it was inside settings.”
Participant · early in the interview
Product demonstration with a fictional sample interview.
- Lower per-job costOn the optimised AI research pipeline.
- 38%
- Faster synthesisMedian end-to-end synthesis at the new model mix.
- 2.1×
- Eval regressionMeasured against their internal evals across the optimised paths.
- 0%
Our role
User Evaluation already had a working research product. Our engagement focused on the infrastructure behind it: model selection, transcription, synthesis and the checks that protect output quality.
The brief
Keep research useful as usage grows.
Processing audio, video and text adds an inference cost to every research session. As volume grew, User Evaluation needed to reduce that cost and the time spent waiting for synthesis.
The existing pipeline and its quality benchmarks gave us a starting point. We measured the stages, identified where model capacity was being wasted, and tested targeted changes.
The work
Change the pipeline. Check the output.
We worked within their existing infrastructure. Each change had to earn its place against the internal eval suite.
01Measure each stage
Audit the cost and latency of calls across transcription, synthesis and reporting.
02Match models to tasks
Use lighter models where they meet the quality bar. Keep larger models where the task needs them.
03Reduce repeated work
Batch transcription where timing allows, shorten synthesis prompts and cache repeated retrieval.
04Check before release
Run changes through the regression harness, then monitor per-call cost and latency in production.
OpenAI · Anthropic · Whisper · Postgres
The quality bar stayed in place. The 0% regression figure refers to their internal evals on the optimised paths. It is the benchmark used to judge these pipeline changes.